About this station.
Here you can learn about the equipment and setup of this station. If you are interested in setting up your own radiation monitor the please visit Radmon.org for information.
The equipment used.
There are two main elements to the Schmoozie Radspod Radiation Monitoring station. These comprise of the Geiger counter, the detector, and Radlog software, the recorder and publisher.
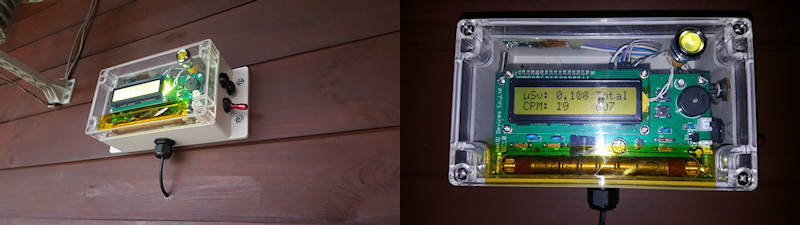
The Geiger counter is a NetIO GC-10 Geiger counter using a SBM-20 Geiger Muller tube. The GC-10 provides a direct TTL serial output of the current CPM (counts per minute). Every second, the current CPM is transmitted to the Radlog software wirelessly by way of a TTL serial transmitter at the Geiger counter and an TTL serial receiver at the PC running Radlog. The TTL serial signal is converted to RS232 with a small FTDI TTL to RS232/USB adapter. The PC is a headless rack-mount Intel Atom with sufficient storage and memory for running small logging applications as it has a fairly low power consumption using around 40 watts at full CPU and hard drive usage. When Radlog receives the CPM data from the Geiger counter it records this both locally and to the Radmon network every minute. Historical records are kept locally and averaged data is processed on the Radmon server to be displayed.
The Geiger counter is mounted outside under a canopy. The counter has been mounted into a sealed enclosure with a window at the front where the Geiger Muller tube is and sealed with Kapton Tape. Several steps have been taken to ensure humidity and moisture resistance for the Geiger counter including using hermetically sealed switches and buttons and dessicant has been installed inside the enclosure to remove any traces of moisture.
The software.
The software used is Radmon from Radlog.org. The data is received wirelessly and then processed. The locally collected data consists of the current 24 hours radiation graph, distribution plot, long term trend and raw data in text format. Every 60 seconds the data (the current CPM) is uploaded to Radmon where it is shown on a world map along with other Radmon users. The data is also averaged over various samples and displayed on the Radmon website. The same data is shown on the local Schmoozie Radspod website by pulling the averaged data from Radmon and displayed locally through the Schmoozie Radspod website. The Radmon.org map is also shown locally on the Schmoozie Radspod website